Landing Page
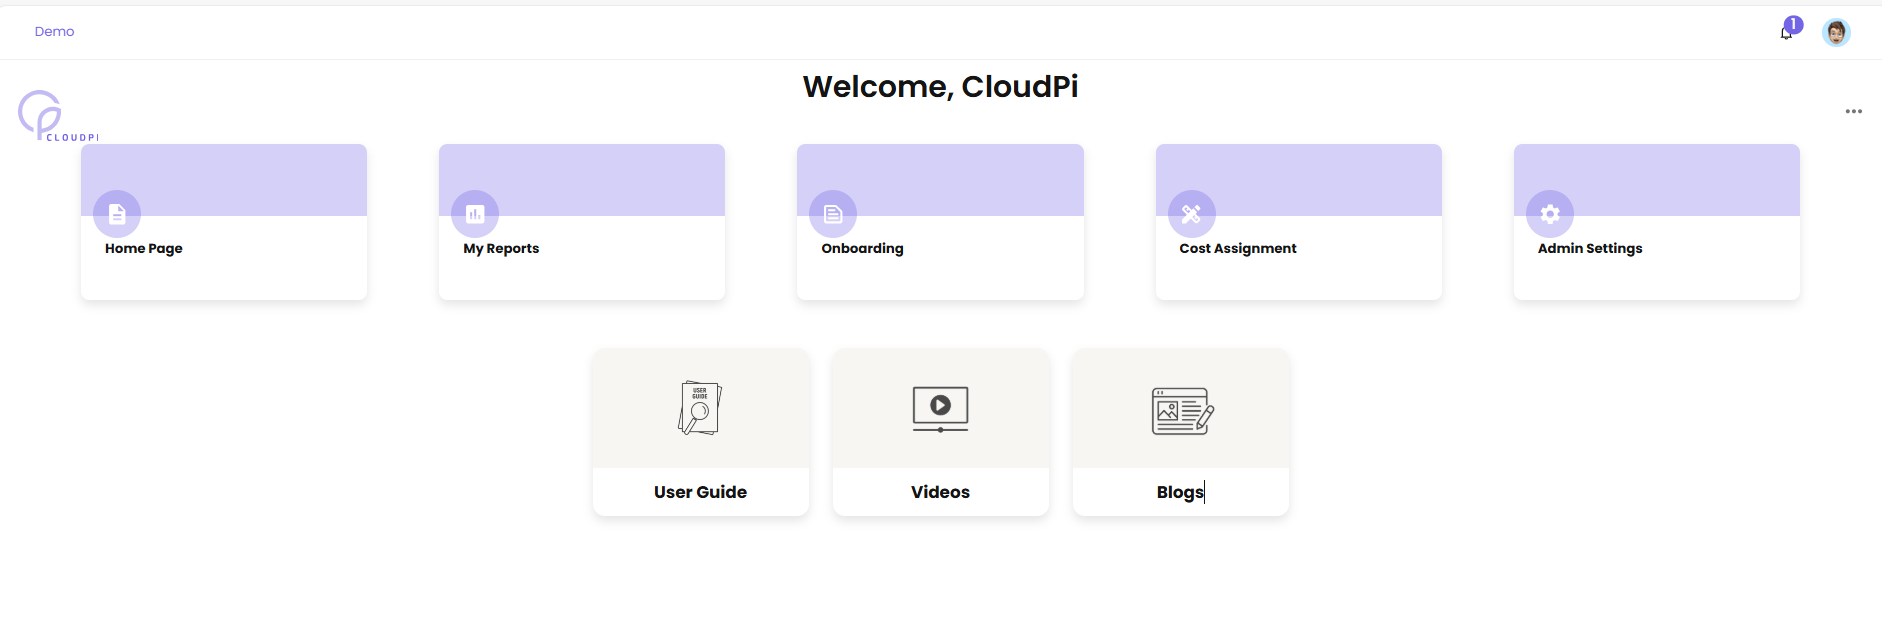
The landing page is your starting point after you sign in. It acts as a workspace launcher and a quick way to jump into the CloudPi areas you use most. From anywhere in CloudPi you can click the logo in the upper-left (or use Workspace Selector > Landing Page) to return to this screen instantly.
Landing Page User Stories
Use the landing page to:
- Open the workspace Home Page for an at-a-glance view of KPIs, trends, and alerts
- Jump directly to My Reports, Onboarding, Cost Assignment, or Admin Settings
- Access help content such as the User Guide, Videos, and Blogs
Note
Tiles and navigation options are role-based. For example, Admin Settings is typically available only to users with admin permissions.
Landing Page Tiles
The landing page presents tiles that open the corresponding CloudPi area:
- Home Page: Opens the workspace Home Page dashboard (see Workspace Home Page).
- My Reports: Opens reporting dashboards and saved views (see Dashboards).
- Onboarding: Starts cloud onboarding and data collection setup (see Cloud Onboarding).
- Cost Assignment: Configures cost allocation and assignment rules (see Cost Assignment).
- Admin Settings: Opens workspace and tenant-level configuration (admins only, see Admin Settings).
- User Guide: Opens this documentation.
- Videos / Blogs: Opens learning resources.
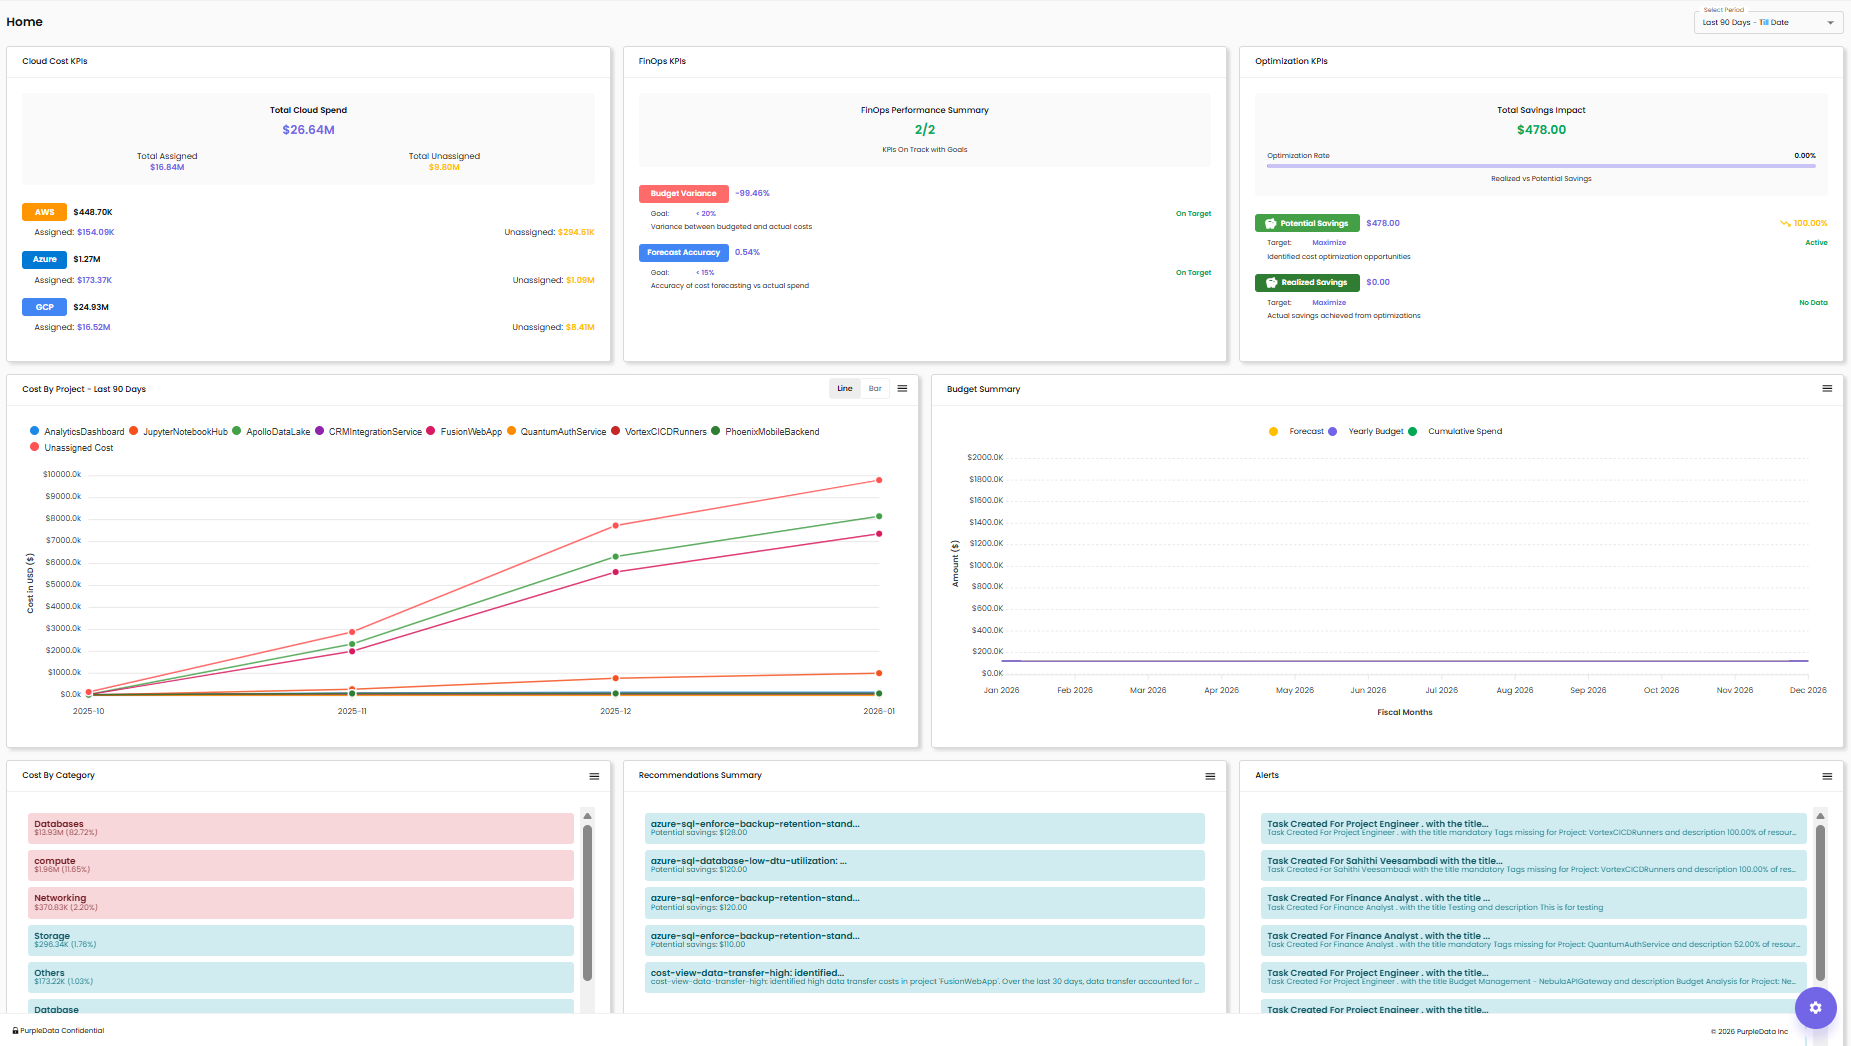
Workspace Home Page
The workspace Home Page provides an executive-style overview of cloud cost, FinOps, and optimization signals. It is designed for quick review and continuous monitoring.
What You Can Do on the Home Page
- Monitor high-level KPIs for spend, variance, and optimization impact
- Change the analysis period using the date filter (for example,
Last 3 Months) - Identify items that need attention (for example, budget variance or forecast accuracy)
- Navigate to deeper dashboards or modules using the left navigation
Home Page Sections
The exact layout may vary by role and configuration, but commonly includes:
Cloud Cost KPIs
Shows a quick snapshot of cloud spend and allocation status: - Total cloud spend - Assigned vs unassigned costs - Provider breakdown (for example, AWS, Azure, GCP)
FinOps KPIs
Summarizes FinOps performance against goals, often including: - Budget variance status - Forecast accuracy status
Optimization KPIs
Highlights optimization performance and impact, often including: - Total savings impact - Optimization rate - Potential savings and realized savings
Trends and Summaries
Common charts and widgets include:
- Cost by Project trend chart
- Budget Summary chart
- Cost by Category breakdown
- Recommendations Summary list to review optimization opportunities
- Health Status indicators (for example, infrastructure health and compliance)
Recommendations and Health Signals
When reviewing recommendations and health widgets:
- Select a recommendation to open details and next steps.
- Use the widget menu (three-line/ellipsis menu) for available actions such as filtering or viewing more detail.